- Ban Điều Hành
How to get a high score on Task 1 of the IELTS
(Bấm vào đây để chọn bài học kế tiếp)
Xem lời thoại bên dưới:
0:02
hi I'm Emma and today we are going to be talking about
0:07
task one of the writing module for the IELTS so again this is task one for the
0:16
writing module of the else
0:18
so a lot of you may not know what happens in the writing section of the
0:23
IELTS so I it's in two parts the first part is going to be something about
0:31
maybe a graph a diagram is up to something to do with having to write a
0:36
report to describe what you see visually the second part is an essay so we're
0:45
going to be talking about the first part today
0:47
ok so the first thing to know is that you're going to have about 20 minutes to
0:52
do task 1 i'm so this is not a lot of time and it's going to be very important
0:59
for you to practices before you actually go into the IELTS task when you have to
1:04
write about a hundred and fifty words describing either a graph a chart a
1:10
table a diagram or of a flow chart you will be marked on four different things
1:18
in this task
1:19
so if it isn't something to keep in mind you're going to be marked on your usage
1:23
of vocabulary
1:25
if you use vocabulary correctly and if you use a lot of different vocabulary
1:30
you're going to be marked on grammar you're going to be marked on your
1:35
ability to do what they ask
1:37
so for example you need to write a hundred and fifty words for this task
1:42
if you write a hundred and twenty words for this task then you didn't really
1:46
meet the task requirements
1:48
and finally you're going to be marked on coherence
1:55
so do do you have in your answer and introduction and conclusion
2:01
do you use words like first of all secondly in conclusion
2:10
so again they're there for different things are going to be marked on
2:12
vocabulary grammar coherence and your ability to do what is asked of you
2:20
so your ability to meet the task requirements ok so let's get started
2:25
so this specific lesson is going to focus a lot on vocabulary
2:29
what sorts of words can you use in this task that will help you to get the the
2:34
top mark you can
2:35
all right let's get started so like I said before in this task you're going to
2:41
have to describe what you see this may be a bar chart or a bar graph so this is
2:49
what is known as a
2:51
bar graph
2:58
you might have to describe something like that you may have to describe a
3:03
line graph the line
3:07
this one is a line graph this one that looks like a pizza
3:18
this is called a pie chart so another thing that you might see on task one is
3:24
a pie charge so we have a bar graph a line graph pie chart
3:35
sometimes you may see two of these you may have to describe a pie chart and a
3:41
line graph or a bar graph and a pie chart
3:46
you may also have to if you don't get one of these
3:50
you may get what is called a flowchart
3:55
so a flow chart shows how something is organized so usually it shows different
4:07
steps so this might be step one
4:09
this might be step two step three so it's a way to show a process in to
4:13
organize information you might get something like this which is a flowchart
4:16
or you may get a table
4:20
so this is just an example of a table
4:29
and depending on which one you get you're going to be using a different
4:33
type of vocabulary so there's specific words to use when you're talking about a
4:38
bar graph there are different words to use with flow charts with tables today
4:43
we're really going to focus on bar graphs and line graphs
4:46
all right let's get started
4:50
ok so now what we are going to do is talk about how to write your
4:55
introduction and vocabulary
4:57
you can use in your introduction for this part of the IELTS so when you
5:03
present a graph
5:04
I like i said before you should have an introduction the body of what you're
5:08
going to say and a conclusion
5:10
this is going to affect your coherence marks so you want to have an
5:14
introduction body and conclusion it's very important
5:17
so a lot of students when they first see i'll just ask one in the academic
5:22
version of the IELTS they get really nervous
5:28
they don't know how to start off what they're going to say how do you start
5:31
off describing a graph
5:33
so what I'm going to talk about now is an easy introductory sentence
5:38
you can use in order to explain your graph
5:41
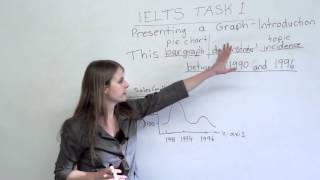
so I have the sentence this line graph so here's an example again of a line
5:47
graph shows the changes in sales between 1990 and 1996
5:54
so this is just an example now if I got a bar graph just change this word this
6:02
bar graph
6:07
I could also say this pie chart this table
6:16
this flow chart so whatever of image you get you can use this plus the type of
6:23
chart it is or the type of figure it is if it's a table if it's a flowchart if
6:28
it's a diagram so this diagram this pie chart this bar graph
6:33
this is almost like a mathematical formula
6:37
just imagine this Plus this Plus this Plus this equals your introduction your
6:42
first sentence in your introduction
6:44
so this bar graph and now we have a verb
6:49
so shows is good what else could you use
6:53
well you could use represents this pie chart represents you could use this pie
7:10
chart demonstrates this bar graph illustrates if you're doing it
7:32
Abel you could say this table lists like this
7:40
so what you want is you want a verb similar to these shows demonstrates
7:45
represents illustrates these are all really good
7:49
verbs to use for your introduction for the first sentence of your introduction
7:54
so this bar graph demonstrates here we have a specific example the changes in
8:01
sales
8:02
oftentimes you'll be looking at changes in sales so for example here in this
8:06
graph we have on this is known as the x-axis so x axis this is just some more
8:18
terminology of graphs so on RX access we see years 1990 1994 1996
8:27
so we're talking about time you may not see something like this but there's a
8:31
good chance you might get a graph that shows time on your x axis this is known
8:37
as the Y access
8:39
so why
8:46
and in this example on the y-axis is sales in millions of dollars so have 300
8:53
million two hundred million 100 million you may get something completely
8:58
different than this this is just an example
9:01
so I'm here so this
9:06
and again this is a line graph demonstrates the changes in sales so if
9:11
you get a different type of graph in this section you just write what it is
9:18
so you write the topic you're talking about this pie graph demonstrates the
9:24
differences between men and women in terms of further education just an
9:29
example
9:30
so whatever your topic is or incidence of disease in some land
9:36
that's another example there might be an incidence prevalence so whatever your
9:44
topic is right here
9:48
so this graph
9:52
demonstrates blank and in the last section you should write sort of the
9:59
date
9:59
whatever they're showing so if you're looking at years which is a good chance
10:04
he will be here you would you could say between 1992 1996
10:11
this was different maybe if we were looking at 2,000
10:16
- 2010 you could say this bar graph demonstrates incidents of whatever over
10:29
a 10-year period
10:36
so again you can have between the state and this date from
10:49
have a year from 1992
10:55
these are just different ways to show time which will be located on the excess
11:00
excess sorry
11:02
ok so again what you want to include in your introduction is first the type of
11:10
graph it is it a pie chart a bar graph you want a verb such as demonstrates
11:16
shows you want to say what the topic you're looking at is and you want to
11:22
talk about the dates
11:23
well what are you looking at exactly two thousand - 2010
11:27
so the boot this is how you should start off your introductory sentence
11:32
ok so we've talked a little bit about what your first sentence for this test
11:39
can be there are there are other ways to do it but the way I showed you is a
11:43
great formula
11:44
that's easy to remember and that will really help you with vocabulary marks
11:48
and coherence
11:50
so right now what we're going to focus on is some key terms key vocabulary
11:55
you can use when describing movement of a graph or a line of our graph or line
12:03
line graph
12:04
ok so let's get started so usually when we look at grass
12:10
there are three different patterns we might see three different trends we may
12:15
see an upward trend where it goes up we may see a downward trend or we may see
12:25
it remaining stable so you may see multiple translated a graph so for
12:32
example graph might have an upward trend reach a peak then
12:40
then we're kind or maybe the downward 10 first it goes up a bit and then it
12:46
becomes stable but how do we talk about describing movement
12:52
what are some key words we can use so what we're talking about a upward trend
12:57
some of the words we can use
13:00
I'll talk about verbs first we can use increase so we can call this in
13:11
increase we can say it went up and say it climbed it jumped it rose
13:32
so notice when we're talking about describing movement on the IELTS the
13:42
verbs we use these are all verbs
13:44
what tense today and if you said simple pastor correct
13:50
you want to be using a simple past when you're describing movement for IELTS
13:54
task one so we can say if this was talking about sales for example so we
14:01
look at that example before sales and this is years so we have maybe 2000 -
14:08
2010 gets a sales rose sales increased sales went up sales climbed sales jump
14:17
and then we would usually say between two thousand and two thousand ten
14:24
so this is talking about the the verbs but we can also turn this into now so
14:32
rise the noun form of of sorry Rose is a rise
14:38
so for example there was a rise in two thousand we could say there was a and
14:56
increase so this is one way to do it
15:05
I'm so if we have been down here if we decided to use it in a verbal form we
15:14
could say
15:15
sales rose between two thousand and two thousand ten ok so we looked at when it
15:36
goes up when trends go upward
15:39
what about downward trends what are some of the words we use with that
15:43
so we'll start off with verbs we can talk about a decline sales declined
15:54
you can say decreased
15:59
and again
16:02
simple past we can say went down we can say dropped we could say plummeted
16:19
if it's a very steep drop
16:23
oh ok so we can say sales plummeted and we can also say so we have declined
16:36
decreased went down dropped limited finally slump
16:43
so these are all ways to say it went to the arrow down
16:53
so again these are all burbs
16:57
so we could write it here sales decreased between two thousand and two
17:07
thousand ten sales went down between 2000 and 2010
17:17
if we decide to use a noun decline
17:23
we can say I decline
17:27
we can say a decrease a drop a slump
17:33
so many of these also have a noun form so there was a a decline say a decrease
17:50
in a slump
17:51
and so when it's important to note that
17:56
so here is what we're using the noun here is what we are using the verb
18:00
when we use the noun remember it's there was a decrease of rise
18:08
whatever in here we can actually write the topic and sales or whatever your
18:17
topic is between and then we have a date or if we use the verbal form you have
18:29
the topic sales verb and the date again
18:35
ok so finally the third trend when nothing happens
18:44
we can say it remains steady
18:50
you can also say it remains stable remains stable
19:03
it remains steady we can also call this a plateau plateau
19:16
ok so there was no sorry
19:23
sales remained steady between 2000-2010 sales remained stable
19:41
there was a plateau and sales between two thousand and two thousand ten ok so
19:55
again when you do this part of the task
19:58
you don't want to reuse the same words again and again and again it for the
20:03
whole time you're describing the movement you use when up multiple times
20:08
the the sales went up and then they went down and then they went up again and
20:12
then they went down again
20:14
the examiner is going to give you low marks on your usage of vocabulary
20:18
they want to see variety so try to memorize
20:21
you don't have to memorize all of these choose a couple maybe use increased
20:26
maybe use rose decreased dropped remain steady
20:32
I one thing I wanted to say as well with plummeted
20:37
I think I said this before but it's a really
20:40
steep drop so if the decline is like this
20:45
that's not plummeting plummeting is a very steep drop
20:50
now another thing we can do is we can add adverbs and adjectives to our are
20:56
nouns and verbs in order to explain the degree of change
21:01
so we just described movement well what else can we add here
21:07
so basis so we can add words like significant there was a significant
21:27
increase meaning an important increase
21:31
it's a quite a big increase we could say there was a a steady increase we can say
21:45
there was a dramatic
21:52
so for example if we had to draw these a dramatic increase would be a very sudden
22:01
increase that's another word sudden we could say a steady increase its not so
22:09
dramatic
22:13
we could say a significant which is more than study less than dramatic maybe
22:20
something like this
22:23
so significant steady side and dramatic
22:27
these are all adjectives so where would I put it here
22:31
there was a we use the word increase which can be a noun
22:45
there was a sudden increase there was a dramatic increase there was a
22:51
significant increase
22:52
we can also use these with the words decrease there was a sudden decrease
22:56
there was a steady decline
22:59
there was a dramatic drop
23:03
although that one drop usually is dramatic so it's better to use with
23:07
decline decrease so increase so something like this will help your mark
23:15
if you're using both adjectives to describe what type of increase along
23:20
with nouns
23:21
similarly we can turn all of these into adverbs significant is an adjective
23:28
if we want to describe it as a verbally Sydney significant that can lead
23:33
steadily dramatically suddenly sales talking about an increase sales
23:44
increased or went up any of those herbs we learned earlier increased
23:52
dramatically
23:55
between 2000 and 2010 sales increased steadily sales increased significantly
24:08
sales increase rapidly these are all different words we can use to help us in
24:15
terms of our I'll score
24:16
so again this lesson has focused mainly on vocabulary so we haven't really
24:23
talked so much about how to get good coherence marks meeting your
24:27
organization so that will come in at a later lesson we will talk about how to
24:32
write a proper introduction body and conclusion for now this is focusing on
24:37
vocabulary and how to get your vocabulary marks the highest you can get
24:42
them
24:42
so again the main thing to remember is you want your vocabulary to be varied
24:48
meaning you don't want to use the same way to get and again you want to have an
24:54
introduction a body a conclusion and also you want to to have variety so
25:01
there was a sudden increase you want to use now sometimes maybe you want to also
25:06
show you can use these words in the verb form again when you do use it in the
25:12
verb form
25:13
remember simple simple past
25:16
so for more information on this i highly recommend visiting us at www.engvid.com
25:22
another great resource if you're planning on doing the IELTS is good luck
25:29
I alt.com it's an excellent website that will give you more information on the
25:34
different types of tasks you will be required to do so until next time take
25:39
care