


IELTS Writing: Numbers and Pie Charts
- Ban Điều Hành
- Sep 4, 2016
- 11 min read
Updated: Dec 19, 2023
(Bấm vào đây để chọn bài học kế tiếp)
Xem lời thoại bên dưới:
0:02
Hi there. My name is Emma, and in today's video, I am going to talk
0:06
a lot about the IELTS test, specifically writing task one.
0:11
I'm going to teach you about a certain thing
0:14
you might see on the IELTS, and that's a pie chart. I'm going to explain what a pie chart
0:20
is, and ways to talk about pie charts in order to improve your vocabulary mark for the IELTS.
0:28
Many students get really, really confused when they see graphs on the IELTS, and they
0:34
get really confused trying to talk about numbers, specifically. So, in this video, I'm also
0:39
going to talk about: How do we describe numbers when we're looking at pie charts?
0:44
How do we describe percentages? You know, and how can we
0:49
make our vocabulary very varied? Okay?
0:54
So, let's get started.
0:57
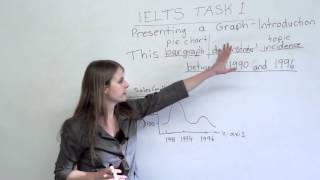
The first thing I want to do is talk about: What is a pie chart?
1:01
So, I have here three different types of graphs.
1:04
Three different graphs you might see on the IELTS, in the
1:08
writing section, in the very first part of the writing section. Okay? You might see a
1:14
picture like this, like this, or like this. So, one of these looks like a pie, something
1:21
you eat. Which one do you think looks the most like pie?
1:26
If you said this one, you are correct.
1:30
This is what we are going to be talking about today. We can call it either a "pie chart"
1:35
or a "pie graph". Both are correct. You might also see this one, this one is called
1:42
a line graph; or you might see this, which is called a bar graph.
1:47
So, let me write that on the board. So, "pie chart", "line graph", and "bar graph".
2:03
You might also see a process,
2:06
a diagram, or maybe even a table on the IELTS. But for today, we are only going to be focusing
2:13
on pie charts.
2:16
Okay, so what is a pie chart? A pie chart shows us percentages. Okay? So, if we look
2:26
down here, I have here what I spend my money on. Okay? I want you to imagine each month,
2:34
all the money I make, all my salary, this is what I spend it on.
2:39
I spend some of it on rent, I spend some of it on food,
2:44
I spend some of it on transport or transportation,
2:48
and I spend some of it on fun. Okay? So, on the IELTS, you might have to describe something
2:57
like this. It might be more complicated. Sometimes you might actually have two pie graphs or
3:04
pie charts that you might have to compare and describe, but in this case, let's start
3:09
out a little bit easier.
3:11
So, I want you to imagine you're writing the IELTS, and you've been told to describe this
3:16
pie chart. What are you going to say about it? Okay?
3:21
Well, the very first thing you should do is you should think about: What does it all mean?
3:26
And by that, I mean: Think about
3:28
how much percent is each thing? Okay? So, for example, for cost of living, how much
3:36
is this? What size does this look like? Although we can't be sure, because I'm not the best
3:42
artist and this is not a perfect circle, I would say this is about 50%.
3:49
Okay? And this, what does it look like to you? Maybe 25%.
3:59
So, food is around 25%. Transport we might
4:03
say... Let's say 15%.
4:11
And fun, maybe 10%. Although, we're not sure. So, on the IELTS
4:19
you might see something like this. You might actually have the percentages written, so
4:24
you already know what it is, or you might actually have numbers. Okay? So, this might
4:28
actually be money, and so it might actually say, like, $500 to rent, $200 to food, and
4:37
so forth. Okay, but the first thing to do is really think about: What are the percentages, here?
4:43
Okay, so to begin a sentence when we're talking about the pie chart, these are three different
4:50
sentences that are very great... Really, really good sentences to use on the IELTS when you're
4:57
talking about pie graphs.
4:59
The first one is: "According to the chart", you can also say:
5:04
"We can see from the chart", or "We can see from the pie chart", "The chart shows that",
5:10
okay? So these are good ways to open up the sentence, and then to actually talk about
5:15
what you see here.
5:18
Okay, so we're now going to talk a little bit about: How do we talk about percentages?
5:24
So, I want you, again, to look at rent. We decided this is about 50%. So, which of these
5:30
three ways can I write this on the IELTS? Should I write it: "fifty percent", should
5:35
I write it "fifty per cent", with a space, should I write it "50%" as a number, or should
5:43
I write it as "half", because 50% is half the total?
5:49
What do you think is the best way to write it?
5:52
Well, the truth is all of these are good. Okay? You will see percent written
5:58
as one word, and also two words; both of these are fine. You can write it as a number, or
6:04
you can also write it as half. These are all great ways to write about pie charts. So,
6:11
let's get a little bit more into how to talk about numbers and pie charts.
6:16
Okay, so let's look at some good sentences you can use when describing numbers and percents.
6:23
So, again, we have the same pie chart. We have rent at 50%, food is about a quarter,
6:30
transportation is about 15%, and fun is at about 10%. So, I've written up some sentences
6:38
to describe rent. Okay? So, what I can say is: "Rent makes up half of the living expenses."
6:47
And notice the verb I use, here. "Makes up", okay? So, this is a phrasal verb, "makes up"
6:55
is great to use when you're talking about pie charts. If I wanted to talk about food,
7:00
I could say: "Food makes up 25% of the living expenses.",
7:07
"Transport makes up 15% of the living expenses." Okay?
7:14
We can also change the sentence around, so that instead of "half" being in the middle,
7:19
we start with the percent. "Half of the living expenses are rent." So, this is essentially
7:26
the same sentence, but reversed. "Rent makes up half of the living expenses.",
7:32
"Half of the living expenses are rent." We can also say: "Rent accounts for 50% of the total",
7:42
or "50% of the living expenses". So, again, we have a really, really nice verb that's
7:50
great whenever you're describing a pie chart: "accounts for". It means the exact same as
7:55
"makes up", okay? Could I change this to "half"? Yes. Could I write: "fifty percent", not using
8:06
numbers, but with letters? Yes, I could spell out "fifty percent". It's all the same; it
8:11
means the same thing.
8:13
There is, however, one thing you should be aware of. In English, we do not like to start
8:19
sentences with numbers. So, for example: "50% of the living expenses is rent." This is...
8:27
This is not good. We don't like to start out with a number.
8:32
It would be better to actually write it out. Okay?
8:40
Just like that. Okay, excellent. So, again, these are great sentences
8:46
to use when you're writing about pie charts.
8:49
So, now let's look at some ways to talk about numbers. We've already talked about 50%, we've
8:55
talked about how it can be called half, and how... The different spellings of 50%. So,
9:01
now, let's look at some other different ways to talk about percents. I have down here the
9:07
word "a third". So, if this is my pie chart, a third-there are three pieces-would be about
9:18
this, which is around 30 to 35% is a third. Okay?
9:25
I can also talk about "a quarter", which would be about 25%. Okay? If we looked up here,
9:33
food is about a quarter. We can also talk about "two-thirds", this is where it gets
9:40
a little bit confusing. So, a third is, like I said, we have one out of three. Here we
9:48
have two out of three, which is about 66%. So, two-thirds would look like... One-third,
9:56
two-third. Okay? So, this is one-third and this is two-thirds.
10:02
When we talk about quarters, we can also talk about three quarters, where instead of talking
10:08
about this little piece, we're talking about the rest of the pie. So, whereas this is one
10:16
quarter, this in red is three quarters. Okay? We can also talk about "a fifth".
10:22
So, if the pie has five parts, 20% would be a fifth.
10:29
Okay? So, in red is a fifth. Or we can also
10:32
talk about "a sixth". If we have one, two, three, four, five, six - six slices, six equal
10:38
slices, if I colour in one of these, that becomes a sixth.
10:43
Now, one thing to note. When we talked about "half", we don't use an article. We don't
10:50
say: "a half". Okay? Notice there is no "a" here. When we talk about "a third", "a quarter",
10:59
"a sixth", "a fifth" - we do have "a" there. Okay? So, you don't need "a" with "half",
11:06
but you do need it if you're talking about "a third", "a quarter", "a fifth", or "a sixth".
11:10
Okay, excellent. So, now let's talk a little more about percents.
11:16
Okay, so I made a little bit of a mistake in one of my drawings. A fifth, I think I
11:22
drew actually just four slices. Here, there's one, two, three, four, five.
11:28
So, if I coloured in one of these,
11:34
this slice would be a fifth. Okay?
11:38
So, now what we're going to do is we're going to talk about another way to boost your vocabulary
11:44
mark when you're talking about numbers and pie charts. So, I have here a new pie chart.
11:51
This is about what I like to drink, and what I drank today. Okay? So, if you look over
11:59
here, 42% of what I drank today was tea. I love tea. 25% of what I drank was coffee,
12:08
and 33% of what I drank was milk. To be honest, I also drank water and juice, but to make
12:16
this simple, we'll just stick with these three. Okay?
12:19
So, imagine you get a pie chart like this. Now, again, on the IELTS, usually they're
12:24
a little bit more complicated. But just to learn from, imagine you were given a pie chart
12:30
like this. How could we describe it? Well, again, a great sentence to use is:
12:36
"According to the pie chart", or "As we can see from the pie chart, tea", okay? It says here 42%.
12:46
"Tea accounts for 42 percent of the total". Okay? And again, if I want, I can write it
12:55
as a number, I can even go like this and get rid of the word "percent". There's different
13:01
ways I can do it. They're all correct.
13:04
Now, one thing you can do is you can add words in order to... To be a little bit more specific,
13:12
and to help your vocabulary score. So, I have some words here:
13:16
"exactly", "precisely", "around", "approximately", "nearly", and so forth.
13:20
So, these can help you with your vocabulary mark
13:23
to get a higher score. So, if I'm talking about tea at 42% and I say it's 42%, I'm being
13:32
exact. This is exactly what it is. So, I can use the word:
13:37
"According to the pie chart, tea accounts for exactly 42% of the total."
13:44
I could also use the word "precisely":
13:48
"According to the pie chart, tea accounts for precisely 42% of the total."
13:55
Now, what if I'm just looking at this and 42% is too specific; I just want to be a little
14:01
bit more general? Well, if I don't want to be exact, I can use the words: "around", "approximately",
14:10
"nearly", "close to", "roughly".
14:15
So, in this case, I'm not giving the exact number; I'm
14:20
giving near that number. So, instead of saying 42%, which tea is,
14:26
I can change this to 40%,
14:31
if I add one of these words, because it's not 40% exactly, but it's close enough. So,
14:39
I can say: "According to the pie chart, tea accounts for around 40% of the total", or
14:46
"nearly 40% of the total", "close to 40% of the total".
14:52
One thing to note, here, on the IELTS spelling is very, very important. So, if you use the
14:59
word "approximately", make sure you can spell it, because I know this is a tough word. If
15:05
you think you're going to panic and make a mistake, use "close to", it's easier, and
15:11
not only that, but you actually get-one, two-two words added to the word count for this. So,
15:16
you could say: "close to 40%".
15:20
We could also say, if we're not being exact, we can say: "slightly above" or "just over".
15:28
42% is a bit more than 40%. So, we can say:
15:34
"According to the pie chart, tea accounts for slightly above 40%",
15:42
or "just over 40%". Okay? So, again, this shows that not only
15:49
do you understand the numbers, but you're also using some very good vocabulary.
15:54
Now, imagine if I estimated a little bit higher, and I said this was... It's around 45%.
16:05
What I can say is that:
16:09
"According to the pie chart, tea accounts for slightly below 45%",
16:15
or "just under 45%". Okay?
16:20
So, these are all great words to use to add when you're talking about
16:24
16:30
Okay, so now let's look at some general ways to talk about percent. We've already talked
16:35
about specific, using words like "50%", "half", "a third". What about if you don't really
16:41
want to speak so specifically? Well, I have here some different expressions you can use.
16:48
So, before we get to those, I have a new pie chart. Now, again, you will not see something
16:54
this simple on the IELTS. This is very simple to help you learn. So, imagine if this red,
17:02
little slice, if this represents coffee, and imagine if this green represents tea, and
17:10
this is how much... You know, how much I drink in a day. So, I drink very little coffee,
17:17
and I drink lots and lots of tea. Okay? And you have to describe this. So, instead of
17:22
saying the specifics... Okay? You know, what we can tell from this is that this is a small
17:28
amount, coffee is a small amount, and tea is a very large amount.
17:34
So if we wanted to talk about this, we could use the words: "a small fraction". So, this is a small fraction.
17:45
"A small fraction of the total is coffee." Okay? We could also say: "a small percentage".
17:53
We're not saying specifically what it is. "A small percentage is coffee.",
17:58
"A small number is coffee.", "The lowest percentage is coffee.", "A very small percentage is coffee.",
18:07
and "A very small proportion is coffee." These, essentially, all mean the same thing. They're
18:12
different ways to say a small amount. Okay? Or a small percent.
18:17
So, we can also change up the sentence structure a little bit. Okay? So, for example, if I
18:26
start with coffee, I can say:
18:28
"According to the pie chart, coffee makes up a small fraction of the total.",
18:37
"Coffee makes up a small percentage of the total.", "Coffee makes up a small number of the total.",
18:43
"Coffee makes up the lowest percentage of the total.",
18:47
"Coffee makes up a very small percentage of the total.", and finally,
18:50
"Coffee makes up a very small proportion of the total."
18:55
I can also add the percent, if I want to, here. Okay? So it is good to be specific where
19:02
you can, so you can always put in brackets, and the actual number. Imagine if coffee is
19:07
10%. At the end of the sentence, I can put: "(10%)". Or, I can write the word "at 10%".
19:17
I could actually write out the word "ten percent", and say: "of the total at ten percent". Or,
19:28
if they didn't give me any percents, but imagine if this says two cups a day, and this says
19:33
20 cups a day, what I could also do is write down specifically if they gave you a number,
19:40
what that number is. So, sometimes they won't give you a percent, but they'll actually say
19:44
an amount. If they say an amount, you can actually write in that amount. So, for example,
19:50
if they said two cups a day, I could say:
19:52
"Coffee makes up a small fraction of the total at two cups a day." So that's also possible.
19:59
Now, what about if we wanted to talk about tea? Tea is a large fraction. So, we can use
20:06
the exact same vocabulary, but change the word "small" to "large".
20:10
So, we can say: "A large fraction of the total is tea.",
20:15
"A large percentage is tea.",
20:17
"Tea makes up a large number of the total.",
20:22
"Tea makes up the lowest..." or "the highest"... In this case, we're not
20:27
talking about large, but the opposite of "lowest" is "highest". "A very... A very large percentage
20:34
of the total is tea.", and "A very large proportion is tea." Okay? So, these are great expressions
20:40
to use when you are describing percents and percentages.
20:45
Okay, so thank you for watching this video.
20:50
I would like to invite you to come visit our website at www.engvid.com.
20:55
There, you can actually do more practice questions and actually
20:59
test yourself by taking our quiz to make sure that you understand this video, as well as
21:05
so you can practice using some of these percentages and numbers.
21:09
Thank you again for watching, and until next time, take care.


Comments